
Stacked area
Compare each series and its contribution to the total.
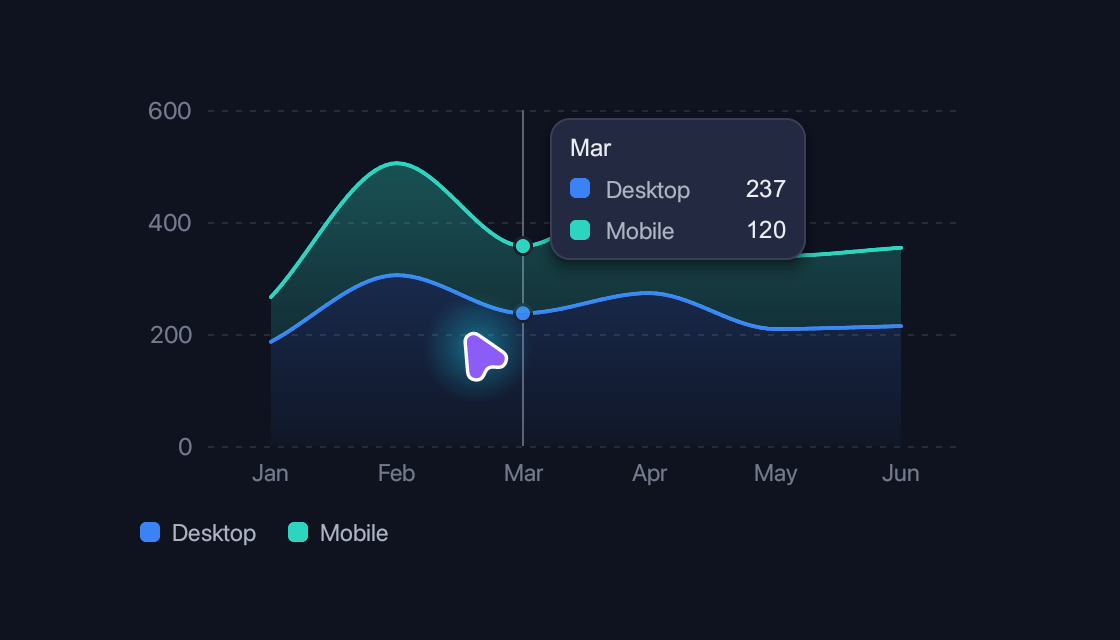
use blinc_cn::area_chart;
use blinc_layout::prelude::*;

pub fn stacked_area_demo(viewport: (f32, f32)) -> Div {
    div().class("demo-chart").child(
        area_chart()
            .width((viewport.0 - 48.0).clamp(1.0, 420.0))
            .height((viewport.1 - 120.0).clamp(40.0, 200.0))
            .series("Desktop", &[186.0, 305.0, 237.0, 273.0, 209.0, 214.0])
            .series("Mobile", &[80.0, 200.0, 120.0, 190.0, 130.0, 140.0])
            .labels(["Jan", "Feb", "Mar", "Apr", "May", "Jun"].map(String::from).to_vec())
            .stacked(),
    )
}
@layer components {
  :root {
    --cn-chart-grid: var(--border);
    --cn-chart-cursor: var(--text-secondary);
    --cn-chart-surface: var(--surface);
  }

  .cn-chart {
    gap: 12px;
  }

  .cn-chart-axis {
    font-size: var(--text-xs);
    color: var(--text-tertiary);
  }

  .cn-chart-axis[data-hidden] {
    opacity: 0;
  }

  .cn-chart-legend {
    gap: 16px;
    font-size: var(--text-xs);
    color: var(--text-secondary);
  }

  .cn-chart-legend-item {
    gap: 6px;
  }

  .cn-chart-swatch {
    border-radius: 3px;
  }

  .cn-chart-c1 {
    background: var(--chart-1);
  }

  .cn-chart-c2 {
    background: var(--chart-2);
  }

  .cn-chart-c3 {
    background: var(--chart-3);
  }

  .cn-chart-c4 {
    background: var(--chart-4);
  }

  .cn-chart-c5 {
    background: var(--chart-5);
  }

  .cn-chart-tooltip {
    gap: 6px;
    padding: 8px 10px;
    min-width: 128px;
    background: var(--surface-elevated);
    border: 1px solid var(--border);
    border-radius: var(--radius-md);
    box-shadow: var(--shadow-md);
    font-size: var(--text-xs);
  }

  .cn-chart-tooltip-title {
    font-weight: 500;
    color: var(--text-primary);
  }

  .cn-chart-tooltip-row {
    gap: 8px;
  }

  .cn-chart-tooltip-name {
    flex-grow: 1;
    color: var(--text-secondary);
  }

  .cn-chart-tooltip-value {
    margin-left: 12px;
    font-weight: 500;
    color: var(--text-primary);
  }

  .cn-chart-band-label {
    font-size: 10px;
    color: var(--text-secondary);
  }

  .cn-chart-note {
    font-size: var(--text-xs);
    font-weight: 500;
    color: var(--text-secondary);
  }

  .cn-chart-note[data-tone="bad"] {
    color: var(--error);
  }

  .cn-chart-note[data-tone="good"] {
    color: var(--success);
  }

  .cn-chart-pie-total {
    font-size: var(--text-2xl);
    font-weight: 700;
    color: var(--text-primary);
  }

  .cn-chart-pie-caption {
    font-size: var(--text-xs);
    color: var(--text-secondary);
  }
}
Usage and properties
Each section demonstrates one chart type. Plots follow their available container; the legend, axes, tooltips and notes are ordinary elements styled by the theme. Data accepts values, Signal or Computed sources.
Use the installation guide to add blinc_cn and its component stylesheet. Create the fixture bindings once, and return the demo from your UI builder. Values marked Bound accept Signal/Computed sources where the API supports them; structural options configure the component at construction.
| Property | Type | Update model | This example |
|---|---|---|---|
series | name + &[f64] | Structural data | Visitors and Returning |
data | Vec<ChartSeries> / Vec<PieSlice> / Vec<ComparisonItem> | Bound alternative | Signal or Computed data for the selected chart type |
labels | Vec<String> | Bound | Mon–Sat |
width / height | f32 | Structural | Container size, up to 420 × 200 logical pixels |
dots() | Builder option | Structural | Used by the line example |
slice / donut / total | PieBuilder options | Structural | Slice values, hole radius and total caption |
values | Vec<f64> | Bound | Sparkline, threshold and histogram measurements |
band / marker / baseline | ChartBand / ChartMarker / f64 | Structural | Performance budgets and reference values |
horizontal / stacked | ChartBuilder options | Structural | Bar and area arrangements |
Keyboard and interaction
Line, area and bar plots reveal nearby values on hover; pie and donut slices show their share. Sparklines are informational. Charts are not keyboard-selectable; provide a table or text equivalent when values are essential.
Customizing it
Add application CSS after the default component layer. These selectors are the restyling surface for this component:
.cn-chart.cn-chart-axis.cn-chart-legend.cn-chart-legend-item.cn-chart-swatch.cn-chart-tooltip.cn-chart-tooltip-title.cn-chart-tooltip-row.cn-chart-tooltip-name.cn-chart-tooltip-value.cn-chart-plot.cn-chart-band-label.cn-chart-note.cn-chart-pie-total.cn-chart-pie-caption
Theme and component variables: --chart-1 through --chart-5, --cn-chart-grid, --cn-chart-cursor, --cn-chart-surface, --text-primary, --text-secondary.
Built-in themes
The Live theme control installs Blinc's own theme bundles, including their colours, focus rings, corner shapes and motion tokens.
pub fn theme_bundle_for(name: &str) -> blinc_theme::ThemeBundle {
    match name {
        "restrained" => blinc_theme::RestrainedTheme::bundle(),
        "expressive" => blinc_theme::ExpressiveTheme::bundle(),
        _ => blinc_theme::HybridTheme::bundle(),
    }
    .with_css(blinc_cn::cn_styles::CN_STYLES)
}
Download the default widget and component stylesheets. Sample assets and licenses are available in the asset guide.
Documentation
From the canonical component guide.
Line, area and bar charts draw on a canvas, with the value axis, category labels, legend and tooltip as ordinary elements. Moving the pointer across a chart marks the category under it (a line through its points, a band behind its bars) and shows each series' value there.
use blinc::cn::prelude::*;

cn::line_chart()
    .series("CPU", &[30.0, 45.0, 40.0, 60.0, 55.0])
    .series("Memory", &[20.0, 25.0, 30.0, 35.0, 40.0])
    .labels(vec!["Mon".into(), "Tue".into(), "Wed".into(), "Thu".into(), "Fri".into()])
    .format(|v| format!("{v}%"))
    .dots()
cn::area_chart() fills down to the axis; .stacked() piles the series, each
filling down to the one below. cn::bar_chart() sets the series side by side
in each category, or piles them when .stacked(); .horizontal() lays the
bars along the width with the categories down the side. Bars are rounded at
the end away from the axis.
cn::bar_chart()
    .series("Desktop", &[186.0, 305.0, 237.0])
    .series("Mobile", &[80.0, 200.0, 120.0])
    .labels(vec!["Jan".into(), "Feb".into(), "Mar".into()])
.curve(ChartCurve::Linear) or Step replace
the smooth curve, .height(..) and .width(..) size it (it fills its parent's
width unless set), .min(..) and .max(..) fix the value axis, and
.no_grid(), .no_axes(), .no_tooltip() and .legend(false) leave parts
out.
Pie and donut
cn::pie_chart() sizes slices by their share of the total, clockwise from the
top; they sweep in, and ease to new values. .donut(0.6) cuts a hole of that
share of the radius, and .total("Visitors") writes the total in it with the
caption under. Hovering pulls a slice out and shows its value and share.
cn::pie_chart()
    .slice("Chrome", 275.0)
    .slice("Safari", 200.0)
    .slice("Other", 90.0)
    .donut(0.6)
    .total("Visitors")
.data(..) takes a list, Signal or Computed of PieSlice; .size(..) sets the
diameter (220 unless set). The total is .cn-chart-pie-total and its caption
.cn-chart-pie-caption.
Live data
.data(..) takes all the series as a list, Signal or Computed of
ChartSeries, and .labels(..) likewise. The chart follows them in place,
easing from the values it shows to the new ones:
let visitors = ctx.use_signal(vec![
    ChartSeries::new("Desktop", vec![186.0, 305.0, 237.0]),
    ChartSeries::new("Mobile", vec![80.0, 200.0, 120.0]),
]);

cn::area_chart().data(visitors).stacked()
Styling
Series take --chart-1 to --chart-5 in turn, from the theme (one palette per
scheme); ChartSeries::color(..) takes any CSS colour for one. The grid, the
pointer's cursor and the rings round dots are --cn-chart-grid,
--cn-chart-cursor and --cn-chart-surface. Setting those variables restyles
every chart:
:root { --chart-1: #16a34a; --cn-chart-grid: transparent; }
The parts are .cn-chart, .cn-chart-plot, .cn-chart-axis (a crowded
label carries data-hidden), .cn-chart-legend with .cn-chart-legend-item
and .cn-chart-swatch, and .cn-chart-tooltip with its -title, -row,
-name and -value.
Sparklines, thresholds, histograms and comparisons
These are drawn on the same plot:
let frame_times = vec![12.0, 18.0, 15.0, 22.0];
let diffs = vec![1.0, 2.0, 2.5, 3.0, 5.0];

// A trend beside text: no axes, grid, legend or tooltip, 100 by 24.
cn::spark_line(vec![1.0, 2.5, 2.0, 3.5, 3.0]).color("var(--success)").filled();

// Values against budgets: each dot takes its band's colour.
cn::threshold_line_chart()
    .values(frame_times)
    .band(ChartBand::new(0.0, 16.67).label("60 fps"))
    .band(ChartBand::new(16.67, 33.33).label("30 fps"))
    .baseline(16.67);

// Values counted into equal-width bins.
cn::histogram(diffs).bins(30).log_scale().marker(5.0);

// Baseline against current per category, the change written beside it.
cn::comparison_bar_chart()
    .item("Render", 12.5, 14.2)
    .item("Layout", 3.2, 3.0)
    .threshold(10.0)
Any chart takes .band(..) for a shaded value range (good, warning and bad in
turn unless given a colour) and .marker(ChartMarker::new(v)) for a dashed
line at a value. A band's label is .cn-chart-band-label; a comparison's notes
are .cn-chart-note with data-tone="bad" past the threshold or "good" for a
decrease.
Platforms and version
The component API is available in Blinc 0.6.0. The Live example runs in a dedicated worker and requires a compatible GPU surface. Preview and Code remain available when Live cannot start. The canvas has a descriptive label; a full screen-reader DOM mirror is not provided. The gallery integration is based on revision e2e55c24e078.
Recordings and live demos use the default Hybrid theme with bundled Noto Sans. The recording uses a 560 × 320 logical viewport at twice that resolution. Live follows its container and actual display density. Source base revision · Exact build source · Artifact versions and checksums · Font license.